

 Just last week the US Bureau of Labor Statistics released their ''Spending on pets: “Tails” from the Consumer Expenditure Survey," which outlines a wide variety of information relating to pets and pet ownership.
Prepared by Steve Henderson, a supervisory economist in the Office of Prices and Living Conditions, US Bureau of Labor Statistics, the information includes statistics gathered by the U.S. Bureau of Labor Statistics (BLS), Census Bureau, Consumer Expenditure (CE) Diary, the U.S. Department of Labor and interview surveys from 2007-2011.
Interesting key facts contained within the report include:
- Nearly three-quarters of U.S. households own pets totaling 218 million pets in the United States (not including pet fish).
- Americans spent nearly $61.4 billion in total on their pets in 2011, spending an average of just over $500 annually on pets per household.
- Even in lieu of the recession, pet loving families spent consistently on pets from 2007 through 2011, with the share of pet spending staying fairly constant within a range of .9 to 1.1 percent of total household spending.
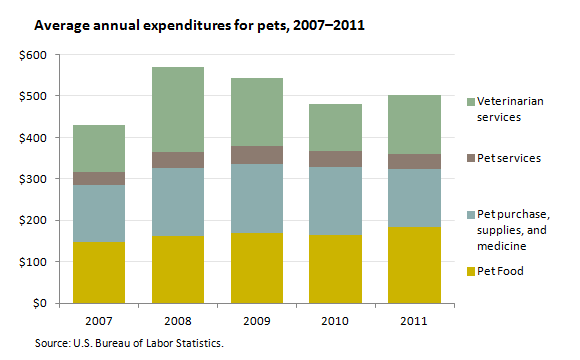
- Pet food was the largest expenditure, rising to an average of $183 in 2011.
- Married couples without children living at home spent the most on their pets in 2011, spending $698 on average, followed by a close second by married couples with children over 18.
- The report also noted: 'married couples with children spent the least on pets when their oldest child was under 6; this expenditure rose by more than $100 if the oldest child was between the ages of 6 and 17, and increased another $100 when the oldest child at home was over age 18.'
- Single-parent households with at least one child under age 18 spent the least on pets, with an average of $267.
- Predictably, the amount households spent on pets rose with income. The middle income families ($35,600 to $58,200) spent $485 on pets annually, more than double the $216 spent annually by the lowest segment (income less than $18,558). The highest pet loving income segment (from $93,800 and up) spent $870 on pets in 2011, more than four times as much as the lowest segment. However, the relative share of spending on pets to total household expenditures stayed near the 1 percent mark for each income segment.
- Not surprisingly, homeowners spent nearly three times as much on pets as renters in 2011, however, surprisingly households in rural areas spent ($716) considerably more than those in central city areas ($393).
- Households with a reference person under 25 had the lowest expenditures per year, with an average of $279 in 2011. This amount steadily increased as the age of the reference person increased, peaking at $636 for ages 55 to 64. It dropped to $547 for reference persons ages 65 to 74 and then to $286 for those 75 and older.
The Editors Desk: Household spending on pets
Beyond the Numbers: Spending on pets: “Tails” from the Consumer Expenditure Survey

No comments:
Post a Comment